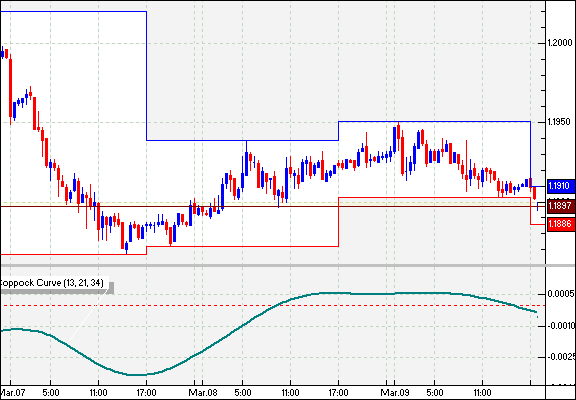
Coppock Curve MT4 Indicator
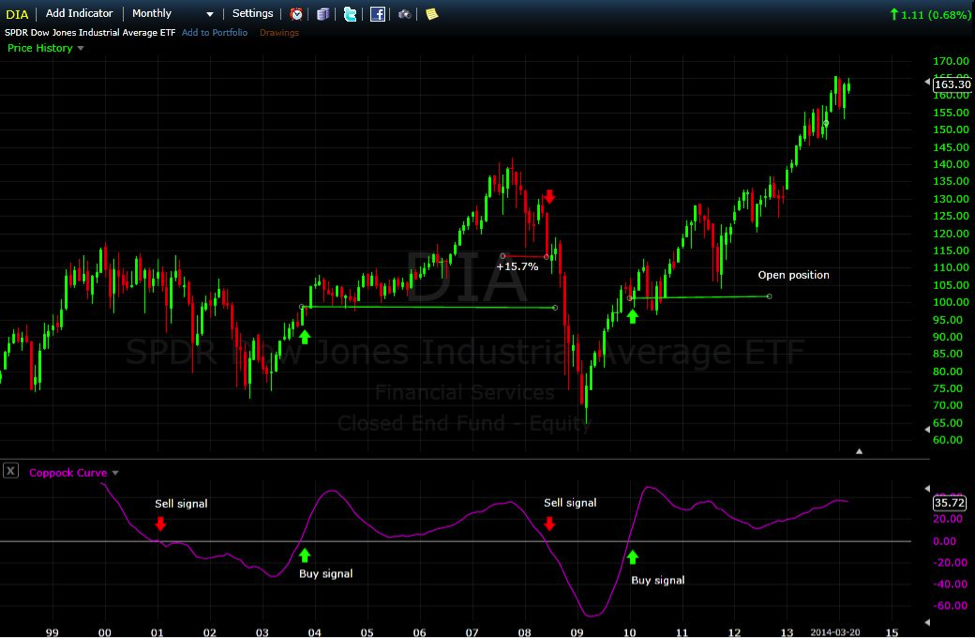
The Coppock curve or Coppock indicator is a technical analysis indicator created by Edwin Coppock, first published in Barron’s Magazine in 1962.
The indicator is designed for use on a monthly time scale. It’s the sum of a 14-month rate of change and 11-month rate of change, smoothed by a 10-period weighted moving average.
[Read more…]